CODE:
Get the code used for this section here
Working with point patterns
We will be working with a small data set of soil information that was collected from the Hunter Valley, NSW in 2010 called HV100. This data set is contained in the ithir package. So first load it in:
library(ithir)
data(HV100)
str(HV100)

## 'data.frame':    100 obs. of  6 variables:
##  $ site: Factor w/ 100 levels "a1","a10","a11",..: 1 2 3 4
##  $ x   : num  337860 344060 347035 338235 341760 ...
##  $ y   : num  6372416 6376716 6372740 6368766 6366016 ...
##  $ OC  : num  2.03 2.6 3.42 4.1 3.04 4.07 2.95 3.1 4.59
##  $ EC  : num  0.129 0.085 0.036 0.081 0.104 0.138 0.07
##  $ pH  : num  6.9 5.1 5.9 6.3 6.1 6.4 5.9 5.5 5.7 6 ...
Now load the necessary R packages (you may have to install them onto your computer first where you will need the install.packages() function):
library(sf)

## Linking to GEOS 3.10.2, GDAL 3.4.3, PROJ 8.2.1; sf_use_s2() is TRUE

library(terra)

## terra 1.7.39

##
## Attaching package: 'terra'

## The following object is masked from 'package:knitr':
##
##     spin
Using the st_as_sf function from the sf package we can define which columns in the data frame refer to actual spatial coordinates. Here the coordinates are listed in columns x and y.
HV100 <- sf::st_as_sf(x = HV100,coords = c("x", "y"))
str(HV100)

## Classes 'sf' and 'data.frame':   100 obs. of  5 variables:
##  $ site    : Factor w/ 100 levels "a1","a10","a11",..: 1 2
##  $ OC      : num  2.03 2.6 3.42 4.1 3.04 4.07 2.95 3.1
##  $ EC      : num  0.129 0.085 0.036 0.081 0.104 0.138 0.07
##  $ pH      : num  6.9 5.1 5.9 6.3 6.1 6.4 5.9 5.5 5.7 6
##  $ geometry:sfc_POINT of length 100; first list element:  'XY' num  337860 6372416
##  - attr(*, "sf_column")= chr "geometry"
##  - attr(*, "agr")= Factor w/ 3 levels "constant","aggregate",..: NA NA NA NA
##   ..- attr(*, "names")= chr [1:4] "site" "OC" "EC" "pH"
Note now that by using the str function, the class of HV100 has now changed from a data.frame to an simple features or sf object. We can do a spatial plot of these points using the plot plotting function.
There are a number of plotting options available, so it will be helpful to consult the help file. Here we doing a no frills plot using just the defaults.
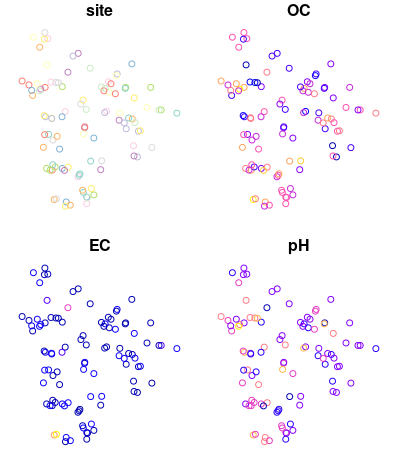
plot(HV100)
The sf object structure is essentially the same data frame, except that additional spatial elements have been overtly specified in the geometry element.
HV100$geometry

## Geometry set for 100 features
## Geometry type: POINT
## Dimension:     XY
## Bounding box:  xmin: 335159.8 ymin: 6365090 xmax: 350959.8 ymax: 6382816
## CRS:           NA
## First 5 geometries:

## POINT (337859.8 6372416)

## POINT (344059.8 6376716)

## POINT (347034.8 6372740)

## POINT (338234.8 6368766)

## POINT (341759.8 6366016)
Key information include the bounding box (sort of like the spatial extent of the data), and the coordinate reference system (CRS), which we need to define for our data set as it is currently NA. To define the CRS, we have to know some things about where our data are from, and what was the corresponding CRS used when recording the spatial information in the field. For this data set the CRS used is WGS1984 UTM Zone 56. To
explicitly tell R this information we can either parse this as Proj4 character strings or EPSG codes (European Petroleum Survey Group). If you are unsure of the Proj4 or EPSG code for the spatial data that you have, but know the CRS, you should consult Spatial Reference site for assistance. The EPSG code for WGS1984 UTM Zone 56 is: 32556. So lets define to CRS for this data.
sf::st_crs(HV100) <- "+init=epsg:32756"
st_crs(HV100)

## Coordinate Reference System:
##   User input: +init=epsg:32756
##   wkt:
## PROJCRS["WGS 84 / UTM zone 56S",
##     BASEGEOGCRS["WGS 84",
##         ENSEMBLE["World Geodetic System 1984 ensemble",
##             MEMBER["World Geodetic System 1984 (Transit)"],
##             MEMBER["World Geodetic System 1984 (G730)"],
##             MEMBER["World Geodetic System 1984 (G873)"],
##             MEMBER["World Geodetic System 1984 (G1150)"],
##             MEMBER["World Geodetic System 1984 (G1674)"],
##             MEMBER["World Geodetic System 1984 (G1762)"],
##             MEMBER["World Geodetic System 1984 (G2139)"],
##
## LOTS OF GUFF :)
##
##     USAGE[
##         SCOPE["unknown"],
##         AREA["Between 150°E and 156°E, southern hemisphere between 80°S and equator, onshore and offshore. Australia. Papua New Guinea."],
##         BBOX[-80,150,0,156]]]
We need to define the CRS so that we can perform any sort of spatial analysis. For example, we may wish to use these data in a GIS environment such as Google Earth, QGIS, ArcGIS, SAGA GIS etc. This means we need to export the sf object of HV100 to an appropriate spatial data format (for vector data) such as a shapefile or KML. The st_write function from sf can be used here. To export the data set as a shapefile:
st_write(HV100, "HV_dat_shape.shp")
#Check your working directory for presence of this file
Note that the object we wish to export needs to be a sf object. You should try opening up this exported shapefile in a GIS software of your choosing.
To look at the locations of the data in Google Earth, we first need to make sure the data is in the WGS84 geographic CRS. If the data is not in this CRS (which is not the case for this data), then we need to perform a coordinate transformation. This is facilitated by using the st_transform function in sf. The EPSG code for WGS84 geographic is: 4326. We can then export out our transformed HV100 data set to a KML file and visualize it in Google Earth.
## Coordinate transformation
HV100.ll <- st_transform(x = HV100, crs = 4326)
# Export file to KML
st_write(HV100.ll, "HV_dat_shape.kml")
#Check your working directory for presence of this file
Sometimes to conduct further analysis of spatial data, we may just want to import it into R directly. For example, read in a shapefile (this includes both points and polygons too). So lets read in that shapefile that was created just before and saved to the working directory, HV_dat_shape.shp:
imp.HV.dat <- st_read("HV_dat_shape.shp")

## Reading layer `HV_dat_shape' from data source
##   `~/HV_dat_shape.shp'
##   using driver `ESRI Shapefile'
## Simple feature collection with 100 features and 4 fields
## Geometry type: POINT
## Dimension:     XY
## Bounding box:  xmin: 335159.8 ymin: 6365090 xmax: 350959.8 ymax: 6382816
## Projected CRS: WGS 84 / UTM zone 56S
The imported shapefile is now a sf object, just like HV100 data that was worked on before, and is ready for further analysis.
Follow this link to get a basic introduction to working with raster data in R.