Towards the end of February of this year I was in the Liverpool Plains for a soil science and field school experience that is for students enrolled in the SOIL3009 unit of study that is offered at the University of Sydney. The field school was based at ‘Nowley’, which is a university owned mixed farming enterprise of about 1500ha.
Nowley
“Nowley”, more formally known as The Holtsbaum Research Station was a gift from Mr E.J. Holtsbaum to the University of Sydney. Mr Holtsbaum, whose family owned Nowley since 1964, made the gift with the view that the farm would continue to prosper under the University’s stewardship, and serve as a center on the Liverpool Plains for the creation and dissemination of innovative technology for agricultural production and natural resource management. Surplus profits from the operation of Nowley are to be allocated for scholarships to help students fund their studies, and to encourage in recipients a sense of giving something back to the land through their degree, should they have the opportunity to do so.
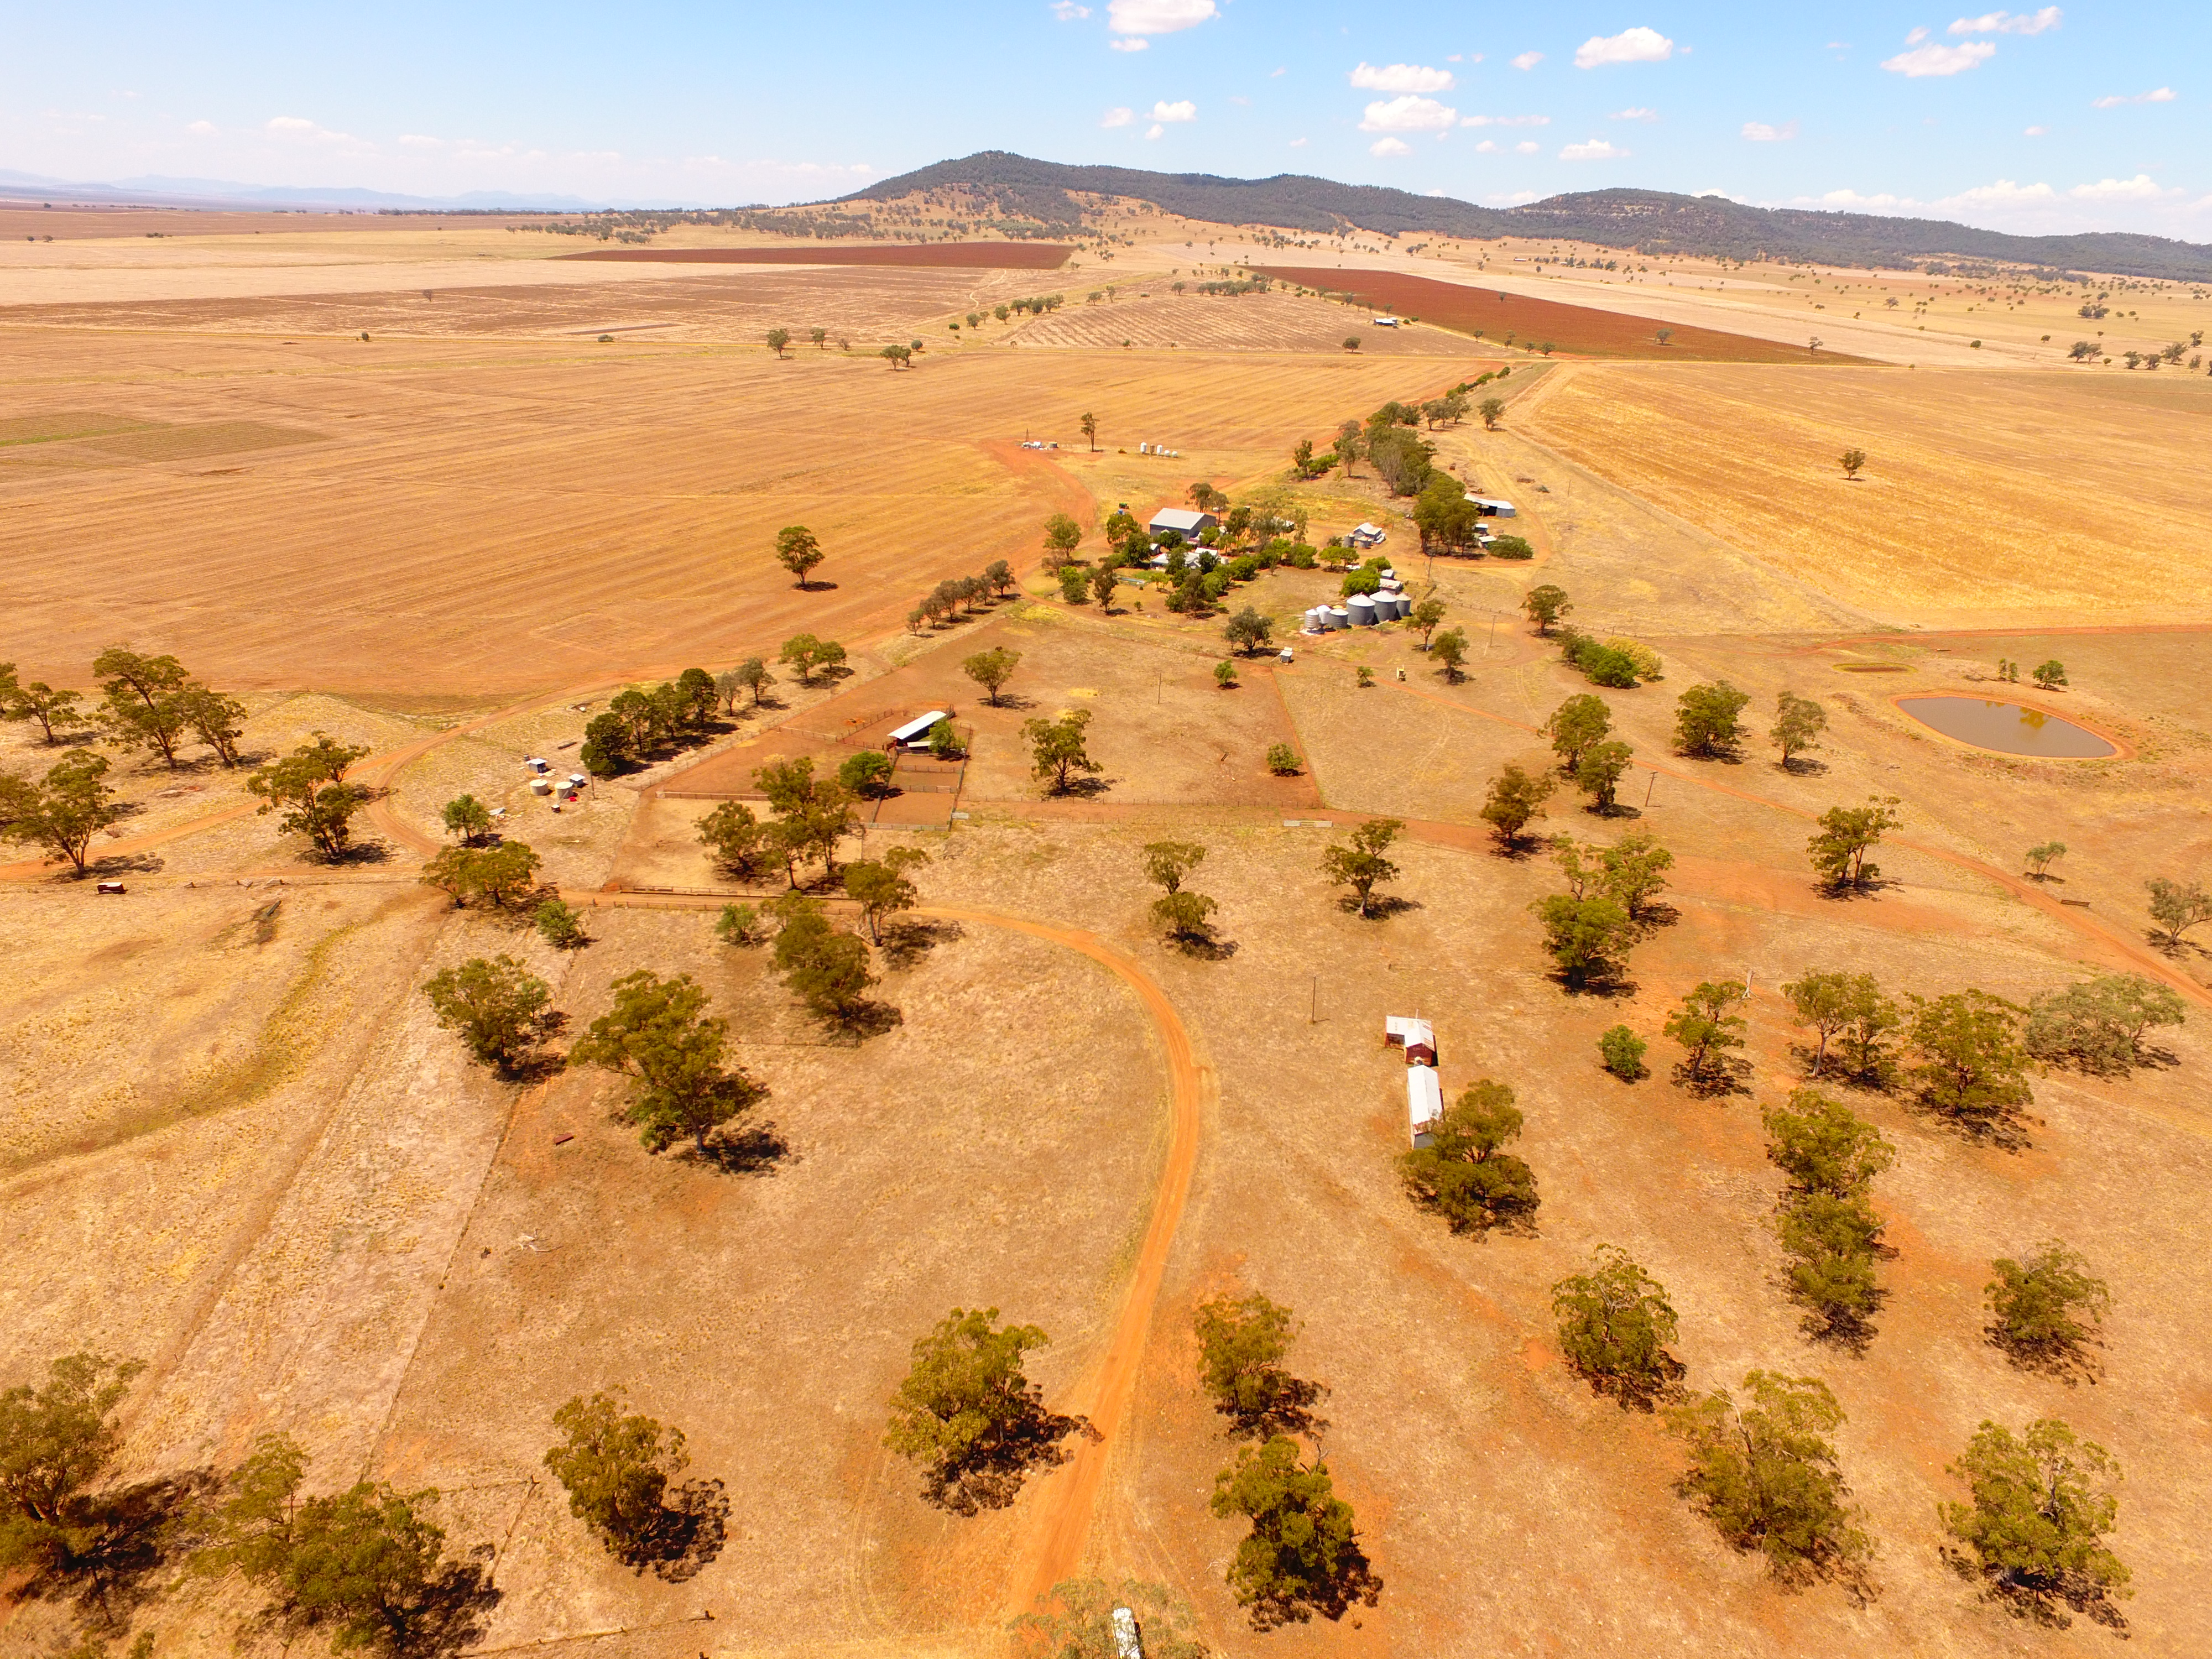
Nowley is located in one of the most versatile and reliable winter and summer dry land cropping regions of Australia, in the Spring Ridge district on the central/north west slopes of NSW. The property is run as a successful mixed farming enterprise centered around crops of wheat, barley and canola in winter, sorghum and sunflower in summer, and a cattle herd of breeders, replacement heifers and bulls. Nowley has mostly fertile basaltic soils, an average annual rainfall of about 600 mm with a relatively even summer and winter distribution, and is close to good regional infrastructure. The variation in soil types and parent materials, and the proximity of a large, natural water body (Lake Goran), means that the property offers unique opportunities to study the impacts of parent material and topography on soil type, and consequently on agricultural opportunities. Nowley will give students a strong sense of the interaction of landscape and agriculture. Stands of remnant native forest on sections of the property will provide invaluable undisturbed reference sites for comparative studies of agricultural and native ecosystems, and the influence of human impacts. Click here for more information about Nowley.
Climate and soil (water) monitoring
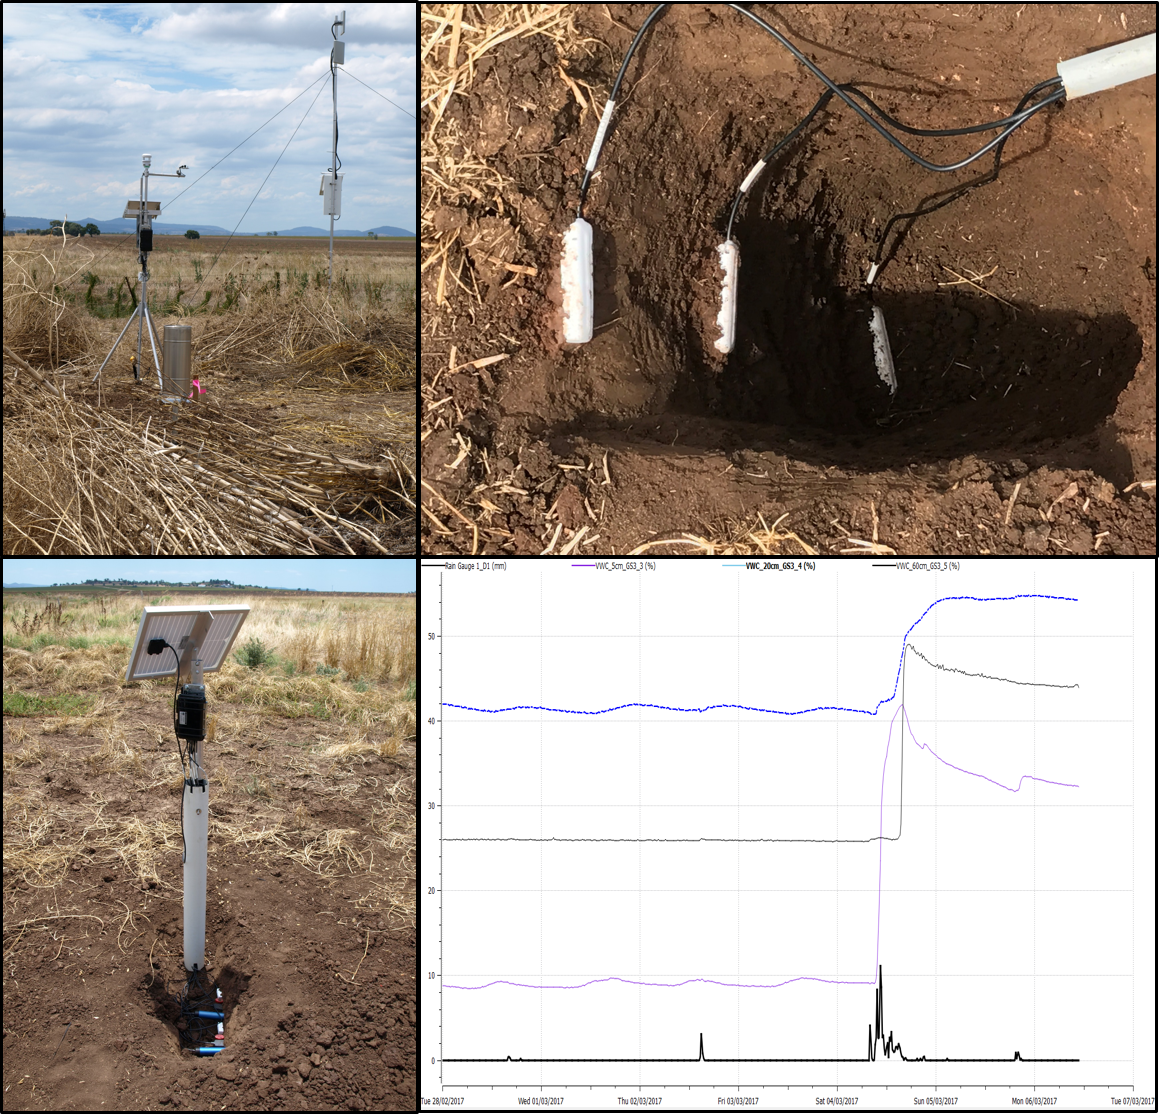
A recent development at Nowley has been the installation of a soil and weather monitoring system. This is just a small scale set up that includes 3 weather stations and 8 soil moisture monitoring sites. The soil moisture monitoring is currently set up in one particular field of the farm along a straight line transect. We have 4 different types of moisture sensors in operation at each site at a depth of about 20cm. We are interested in monitoring soil moisture of course and developing predictive models around forecasting, but this initial set up is intended to help us figure out what the most reliable sensor might be to use in the long term. Some preliminary data suggests that there is substantial variability between the different sensors. The sensors we are trialing are: Decogon GS1 soil moisture sensors, 10HS soil moisture sensor, Vegetronix VH400 soil moisture sensors, and MP306 soil moisture sensors. The weather stations obviously collect a little more detailed information than the soil moisture sensors. There is soil moisture, temperature and conductivity sensing at 3 depths (5cm, 20cm and 60cm) which is measured with Decagon GS3 sensors, as well as the usual air temperature, rainfall, humidity and wind speed observations being recorded too. Every 15 minutes, observations are being logged, then transmitted to a local hub which then transmits this over the internet for real time viewing and analysis.
Currently there is much excitement and activity around soil sensing and IoT stuff, and we are taking a calm approach to it by testing what setup is best. In the future we will likely delve into the modeling and forecasting side of things. A useful thing about these monitoring set ups is that the equipment can be easily re-located to other sites. I think into the future the optimal placement of this equipment will feature heavily. Given the costs of setting it all up though, the possibility of acquiring more sensors is not very high, so optimal placement of sensors is going to be the best solution in the meantime.
The Student Experience
The brief
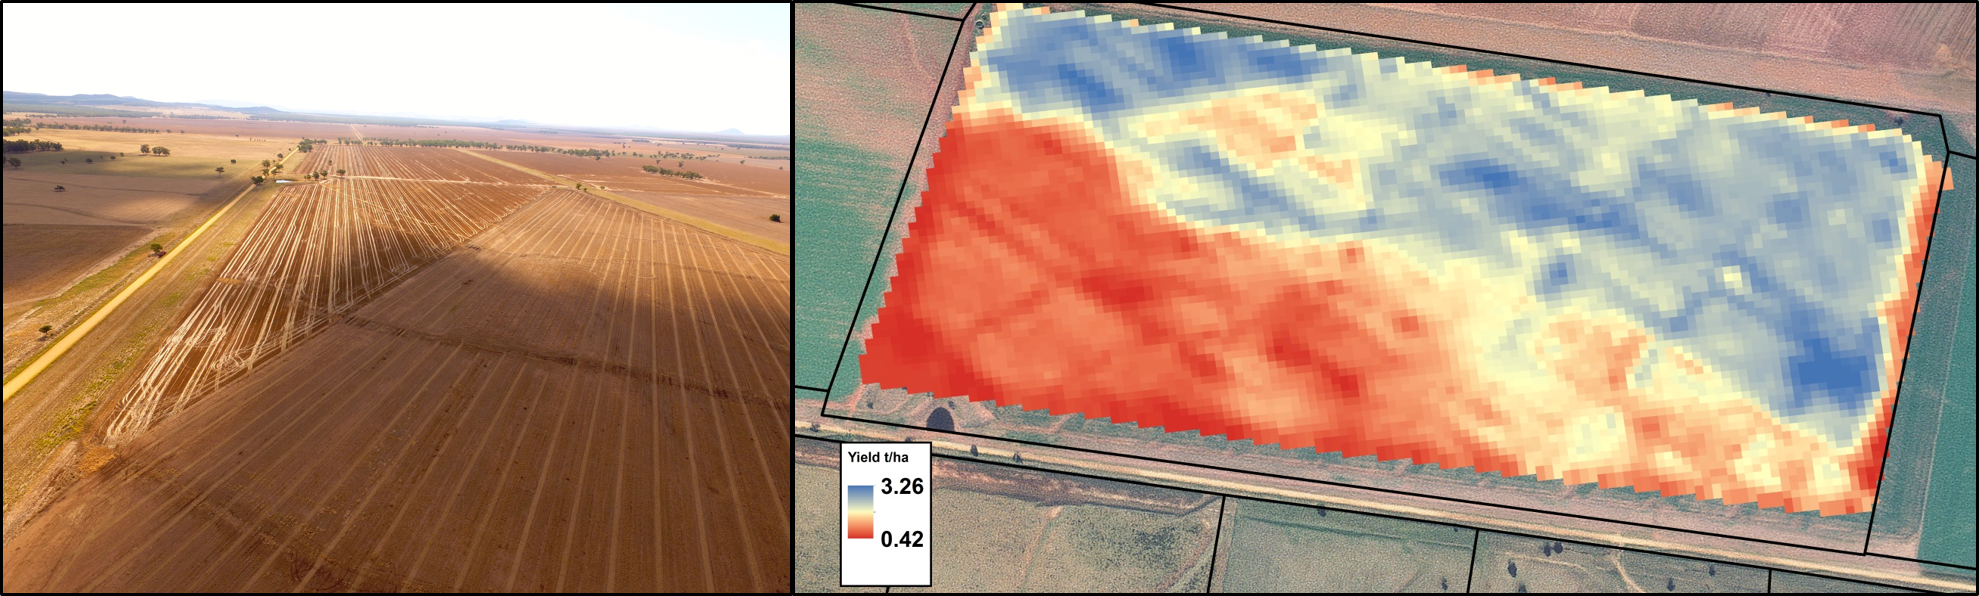
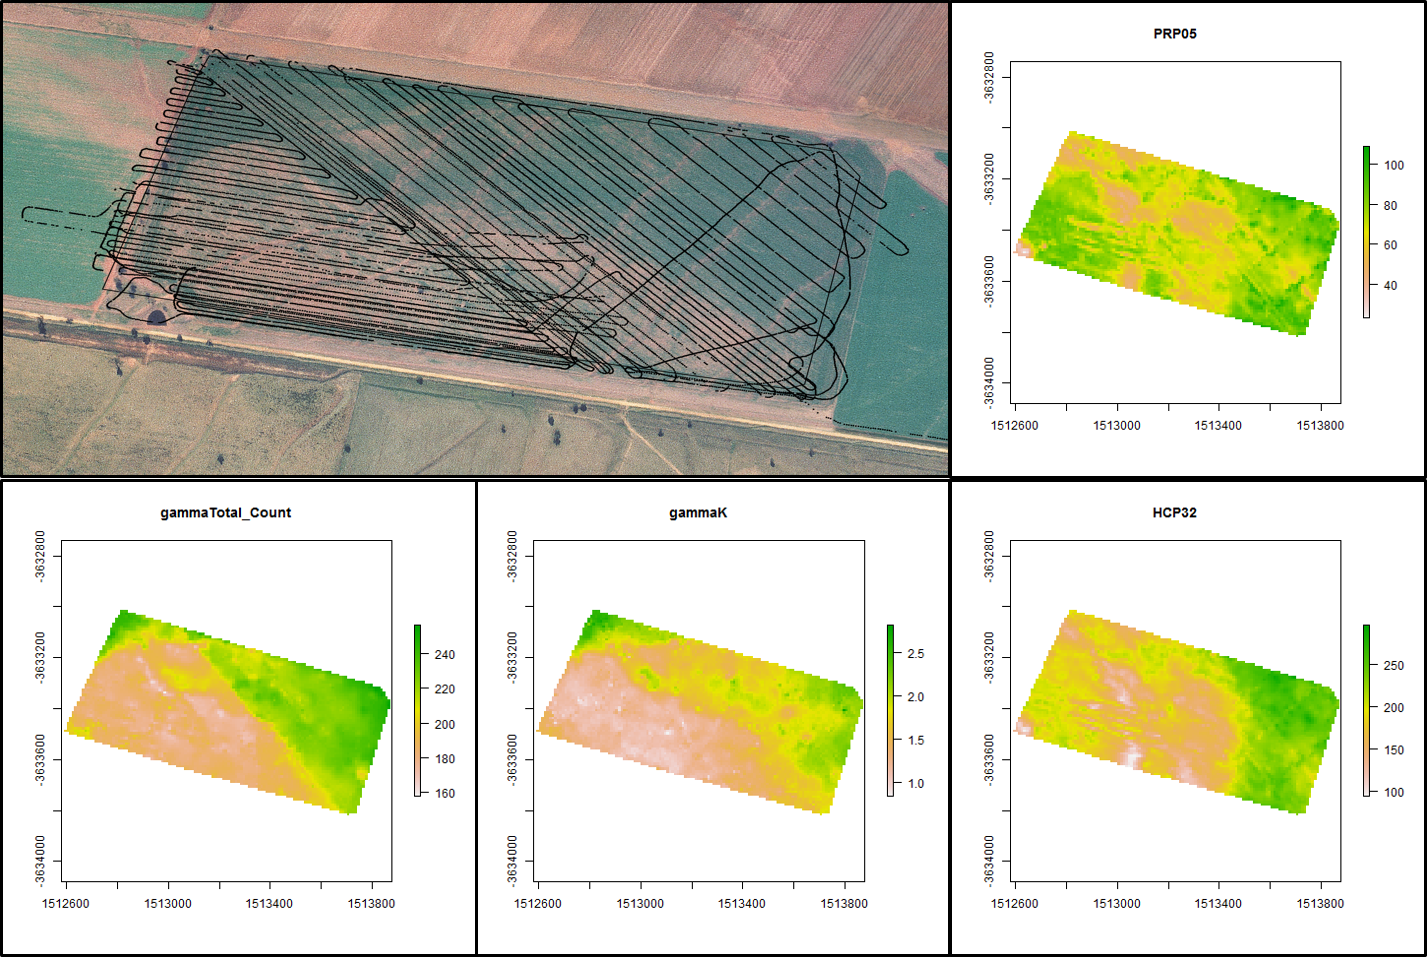
The field trip revolved around two key activities. The first was a problem-based one, and the second was soil profile description. For the first activity we had given the students a problem to solve. This problem was one of low yielding cropping within a field that would otherwise appear to be uniform. The figure below shows a wheat yield map from 2012 which illustrates quite distinct areas of low and high yields. We wanted the students to figure out why this might be the case. To help them, a data gathering exercise was initiated to collect as much information as we could about the physical and chemical properties of the soils. At the disposal for the data gathering exercise was some soil sampling equipment and proximal soil sensing equipment that included a gamma spectrometer, electromagnetic induction equipment, plus portable vis-NIR and x-ray fluorescence instrumentation. In addition to these, various soil physical measurements were conducted at select locations in the field and included water infiltration experiments, soil moisture reading and soil penetration resistance testing.
Most students had some level of soil science teaching at this particular stage of their undergraduate teaching. In order to push their learning to a new level, the problem-based learning exercise brought some of those fundamental learning experiences to a real world situation, but also introduced them to new concepts and techniques such as proximal soil sensing and rapid soil assessment.
To break up the intensive activities associated with the problem-based exercise, the students were re-exposed (from earlier soil science units of study) to soil description. Nowley is an good case study for soil description because the property has some quite distinct soil types. Initially students familiarize themselves with description on a practice pit, but are then pitted against each other both individually and in teams to see who is the best individual and team. With this experience, students get the necessary skill in soil pit description and soil interpretation, but the competition environment brings another level of desire to do well. It has assessment marks attached to it, and it also brings out the competitive streak in most people too. It is a nice concept for teaching and learning. For the potential winners, the hanging carrot was an invitation to attend an Australian inter-collegiate soil judging competition to be held later in the year.
Proximal soil sensing
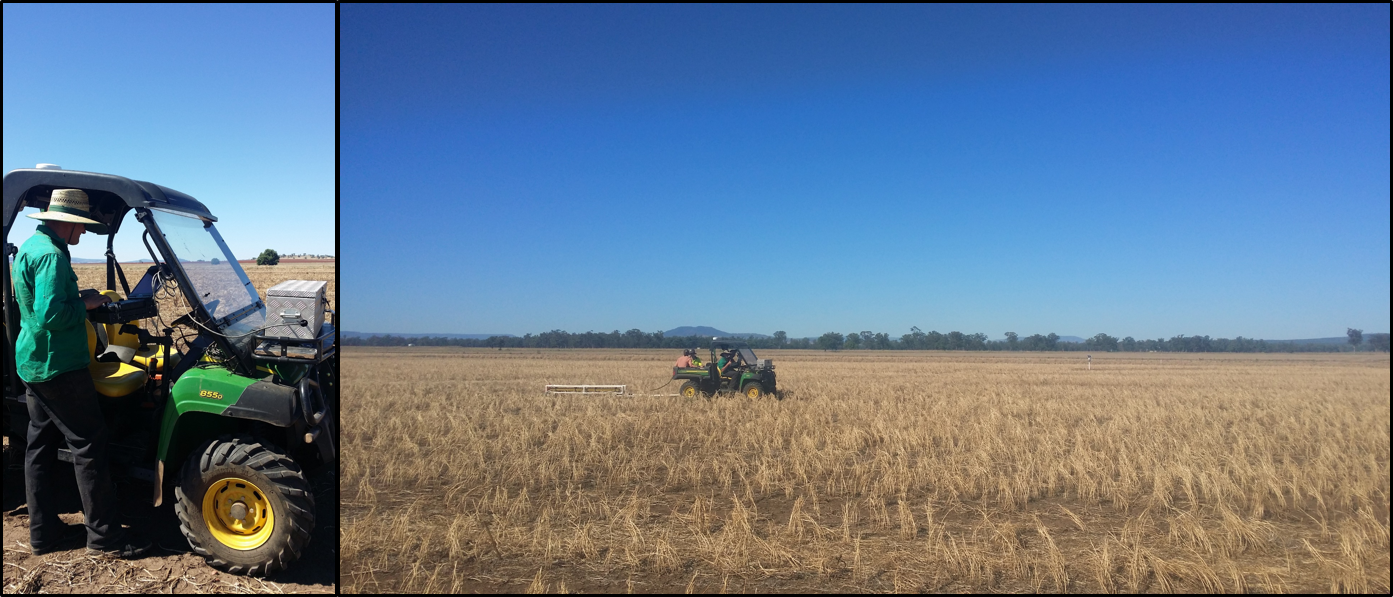
Proximal soil sensing is a relatively cheap and non invasive way of acquiring a lot information about the soil. By a lot I mean high sampling rate across large spatial extents. Proximal soil sensing entailed the acquisition of bulk soil electrical conductivity and gamma radiometric data as well as associated positional and height information acquired via differential GPS device. The two proximal sensors we used in this part of the project were a RSX-1 gamma radiometric detector consisting of a 4L Sodium-Iodine crystal (Radiation Solutions Inc., Mississauga, Ontario, Canada), and a Geonics DUALEM-21S electromagnetic induction instrument (Geonics Ltd, Mississauga, ON, Canada). Data from these instruments were logged continuously with measurements being taken approximately every 1m given an average speed of 5 km h-1. Each logged measurement was tagged with a spatial reference coordinate using a digital GPS receiver (SMART6-L GNSS; NovAtel, Canada). All three instruments were attached to a John Deer ATV and driven on average to a parallel line spacing of approximately 15m.
For some theoretical background, the gamma-ray spectrometer records the amount of radioactive isotopes in the soil (top 30-50cm) based on the principle that each gamma ray photon relates to a discrete energy window which is characteristic of the source isotope. Gamma radiometrics is a passive sensing technique the detects the varying amounts of naturally occurring radioisotopes of potassium (40K), uranium (238U-series) and thorium (232Th-series) from soil as they produce high-energy gamma-rays with sufficient intensities to be picked up by the detector . Additionally, a total count gamma-ray measurement can be taken over the entire spectrum range too. Measurements were recorded in counts per second (cps). The reason for the interest in collecting this data for latter soil inference is that the radioisotopic signature of soils has previously been linked to soil physical, chemical and geochemical properties including soil texture and carbon, among others.
In terms of the electromagnetic induction, the sensors measure bulk soil electrical conductivity. From these data, other soil properties of interest may be inferred using EM data like soil moisture, pH and texture. The DUALEM-21S (Dualem, Milton, ON, Canada) sensor used has dual-geometry (horizontal and vertical) receivers at separations of 1- and 2-m from the transmitter. This configuration provides four simultaneous depths of conductivity sounding or depth of exploration, that correspond to integrated conductivity measurements in mS/m for depths of 0-0.5m, 0-1m, 0-1.6m and 0-3.2m.
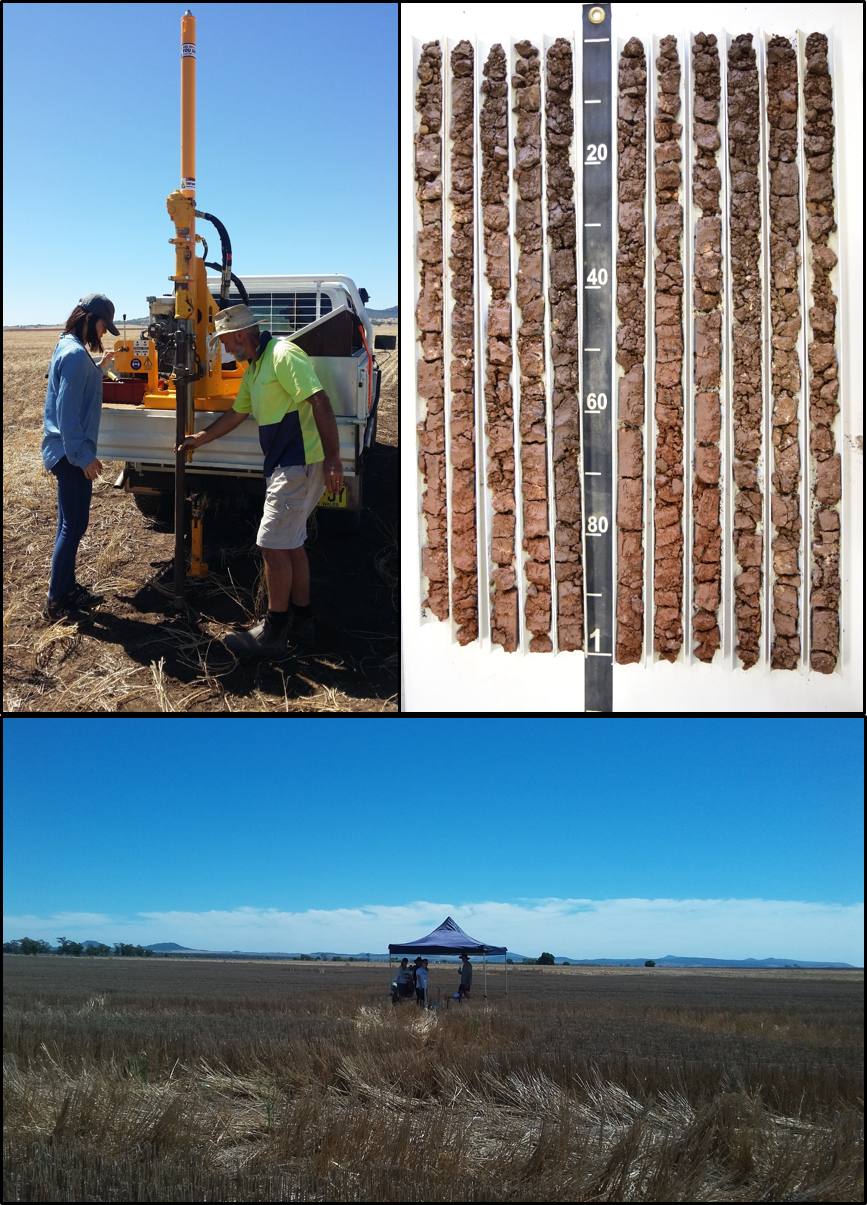
Soil sampling and soil physical measurments
Based on the 2012 yield map we created three clusters based on the quantiles of the values. This essentially created three zones: low, medium and high yielding areas. From each cluster we took 10 soil cores (selected at random) for description and further analysis. At around four sites within each cluster some soil physical measurements were undertaken. Some of the data collected included steady state water infiltration rate, soil moisture measurements and soil penetration resistance measurements.
Soil spectral inference
With the soil cores that were collected in the field we wanted to rapidly make some measurements of key soil properties including texture, soil pH, and carbon and others. So in addition to making some general soil descriptions such as color, horizon designation and aggregate stability we also used our portable visible-near infrared and x-ray florescence spectrometers. Once calibrated these instruments can measure very quickly a number of different soil attributes. For example soil spectral models fitted using vis-NIR spectra and observed soil information can be applied to collected spectra in order to estimate the same attributes. A detailed review of infrared spectroscopy for soil science can be found here. The key for success in regards to soil spectral inference is to have existing spectral libraries that are similar to the soil spectra that is collected in the field. The other consideration is to have a work flow in place to deal with soils in their field condition, rather than their dried ground state which is the usual state in which models are calibrated with. This is an area of research that is not fully developed yet and we continue to investigate how best to use such proximal soil sensing instruments in the field to measure soils in their field state. New developments in this space will make soil measurement much more efficiently and timely. Some key questions that need to be addressed include how to deal with water, which is known to attenuate the spectral signal of soil, and how to deal with the matrix properties of soils i.e. particle size and aggregates etc.
With regards to the portable XRF, these instruments can relatively quickly estimate the elemental concentrations of soils. This is important for evaluating the soil geochemistry which can give insights about micro nutrient levels, and can even give some clues about likely soil pedogenesis. The pXRF does not need to be calibrated in the same way as the vis-NIR as the response spectral peaks are directly related to elemental species and their concentration. A detailed review of using pXRF for soil science can be found here.
Soil judging
At the end of the field trip all the students were pitted against each other for the individual soil judging contest. The competition was organised by Assoc. Prof. Stephen Cattle. The competition is run under a strict sequenced routine that involves timed visualizations of the soil pit. The carrot for the top students was a chance to be involved in a National Soil Judging competition to be held in Toowoomba later on in the year, in addition to top marks for their unit of study assessment.
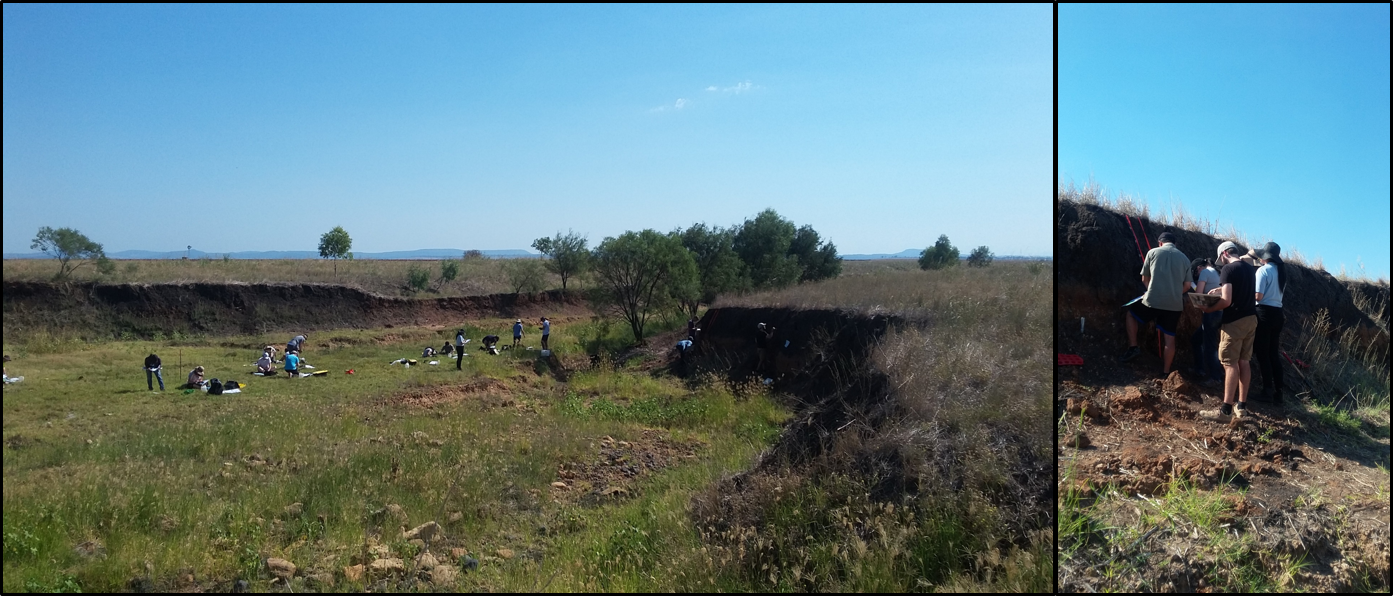
From my understanding, the students need to describe to key features of the soil and classify the soil with respect to the Australian Soil Classification System. Then some agronomic interpretations of the data ensue. The competition soil pit was a steep stream bank adjacent to an agricultural field a little away from Nowley near the township of Spring Ridge.
Thats a wrap
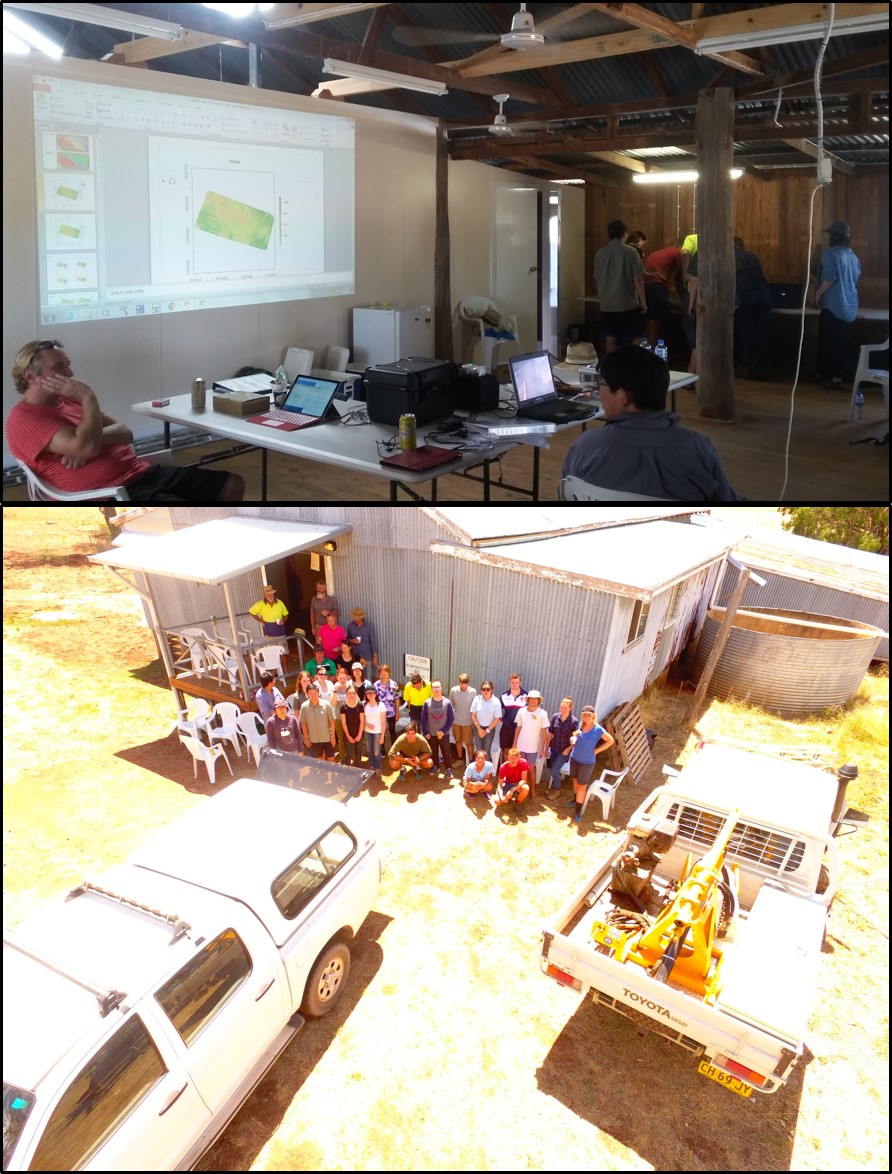
We collected a lot of data on the field trip that is to be used throughout the course of the semester in labs, and to compliment lectures in soil physics, chemistry and pedology. Incorporating the problem-based learning into the unit of study provides context and a good opportunity for self learning. With units of study like this, both the staff and students learn together, as the solution to the problem is not known at the outset. Instead, students and staff are actively learning together through the stages of data collection, compilation and analyses. With this type of experience, everyone is learning together, which I think is highly effective for all parties. Also, I think with this unit of study, the students get exposed to the new technology that is now available to do soil science, which I think is important too. It was a good week had by all despite the rather warm weather we had.